07 April 2025—Consistent growth across Cash Wagers, Non-Adjusted Gross Gaming Revenue, Active Player Accounts and the Average Revenue per Player from February 2023 to 2025.
Key Highlights:
- Strong and consistent growth has been seen across all metrics since the market's inception.
- The number of active accounts increased slightly while the other metrics decreased in February 2025 compared to January 2025.
- The player value remains approximately $250, despite a slight decrease since January 2025.
Ontario's iGaming market launched in April 2022 and has now reached its third anniversary in April 2025. With an increasing number of operators partnering with iGaming Ontario (iGO), the province's internet gambling regulator, the market currently features 49 operators and 84 websites.
As of 19 March 2025, iGO’s latest monthly market performance report with data from February 2025 indicated that the non-adjusted gross gaming revenue (NAGGR) exceeded $280,000 (Canadian dollars) in February 2025. which is the third-highest record since April 2022.
To better understand Ontario’s online gambling market, Casino Group Reviews conducted a growth analysis of key metrics from iGO’s market performance report. The focus was on Cash Wager*1, NAGGR*2, Active Player Accounts*3, and ARPPA*4. This analysis compared the latest data with figures from the market’s launch, the same month in previous years, and the previous month.
- Cash Wagers exclude any bets made using promotional bonuses.
- NAGGR, or Non-Adjusted Gross Gaming Revenue, represents the total cash wagered across all operators, including rake, tournament fees, and similar charges. From this figure, only player winnings from cash bets are subtracted, while operating expenses and other costs are not considered.
- Active Player Accounts are those involved in cash or promotional wagers during a given reporting month. These accounts do not necessarily correspond to unique individuals, as one person may hold multiple accounts with different operators.
- ARPPA stands for Average Revenue Per Active Player Account. It is determined by dividing the total NAGGR by the number of active player accounts within the reporting month.
A Look Back: From April 2022 to February 2025
We started our analysis by looking at the big picture: how far Ontario's gaming market has come since April 2022. Comparing these numbers from then to February 2025, the growth is nothing short of phenomenal.
As you can see, the market experienced explosive growth across the board. Cash Wagers has increased by an incredible 560.33%, and NAGGR has surged by 538.04%. There is also a significant increase in Active Player Accounts, which has grown by 307.58%. Even ARPPA has risen by 56.54%. These numbers highlight the incredible progress Ontario has made and the growing engagement of local players.
Here's a quick snapshot:
| Metric | April 2022 | February 2025 | Total Change | Percentage Change |
|---|---|---|---|---|
| Cash Wagers | $1,079,000 | $7,125,000 | $6,046,000 | 560.33% |
| NAGGR | $43,900 | $280,100 | $236,200 | 538.04% |
| Active Player Accounts | 277 | 1,129 | 852 | 307.58% |
| ARPPA($) | $158 | $248 | $90 | 56.54% |
-
Cash Wagers Growth:
Grew from $1,079,000 to $7,125,000, amounting to 560.33% ($6,046,000).
-
NAGGR Growth:
Increased from $43,900 to $280,100, resulting in 538.04% growth ($236,200).
-
Active Player Accounts Growth:
The number of active players rose by 307.58% (852), from 277 to 1,129 accounts.
-
ARPPRA Growth:
The player value improved by 56.54% ($90), from $158 to $248.
Year-over-Year Growth: February 2023 to 2025
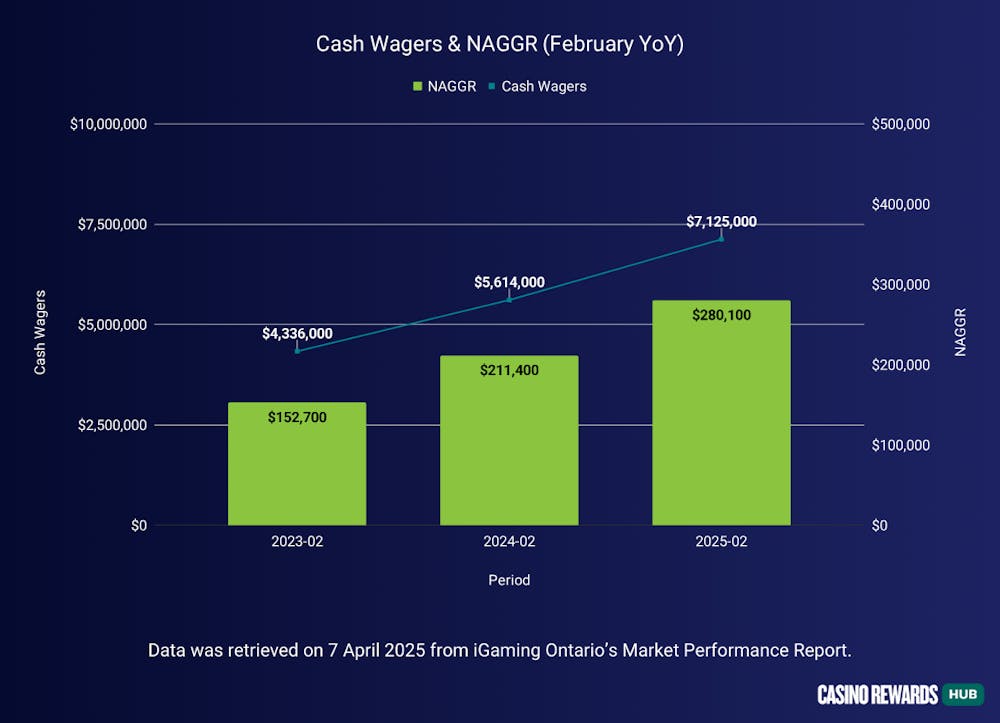
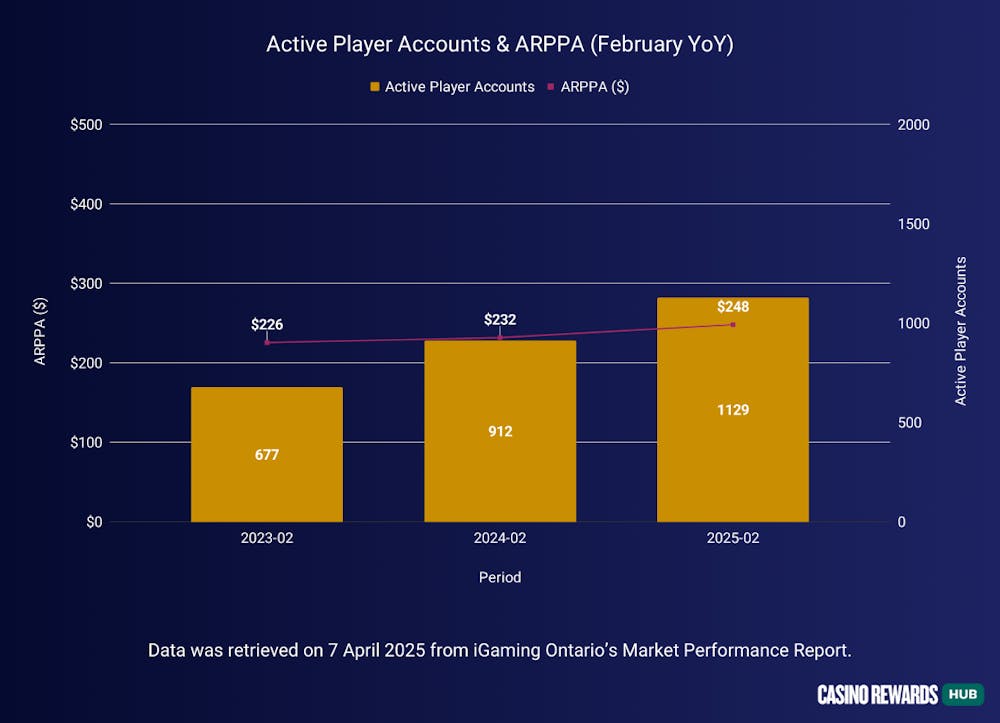
Next, we took a closer look at the year-over-year (YoY) performance for the month of February. This analysis provides a more granular view of the market growth trajectory. These figures confirm the robust growth over the past few years. While the year-over-year growth rates were slightly higher from 2023 to 2024, growth is still strong and consistent across all metrics.
Here's a summary of the YoY data and changes.
YoY Data:
| Metric | 2023-02 | 2024-02 | 2025-02 |
|---|---|---|---|
| Cash Wagers | $4,336,000 | $5,614,000 | $7,125,000 |
| NAGGR | $152,700 | $211,400 | $280,100 |
| Active Player Accounts | 677 | 912 | 1129 |
| ARPPA($) | $226 | $232 | $248 |
YoY Changes:
| Metric | 2023 to 2024 Change | 2023 to 2024 % Change | 2024 to 2025 Change | 2024 to 2025 % Change |
|---|---|---|---|---|
| Cash Wagers | $1,278,000 | 29.47% | $1,511,000 | 26.91% |
| NAGGR | $58,700 | 38.44% | $68,700 | 32.50% |
| Active Player Accounts | 235 | 34.71% | 217 | 23.79% |
| ARPPA($) | $6.24 | 2.77% | $16.30 | 7.03% |
Total Changes from 2023 to 2025:
| Metric | Total Change | Total % Change |
|---|---|---|
| Cash Wagers | $2,789,000 | 64.32% |
| NAGGR | $127,400 | 83.43% |
| Active Player Accounts | 452 | 66.77% |
| ARPPA($) | $22.54 | 9.99% |
January 2025 vs. February 2025
Finally, we examined the month-over-month (MoM) changes from January 2025 to February 2025. While there is a slight dip in Cash Wagers, NAGGR, and ARPPA, it's important to consider that month-to-month fluctuations are normal. The increase in Active Player Accounts is still a positive sign, indicating continued interest and engagement.
| Metric | 2025-01 | 2025-02 | Change |
|---|---|---|---|
| Cash Wagers | $7,836,000 | $7,125,000 | -$711,000 |
| NAGGR | $327,900 | $280,100 | -$47,800 |
| Active Player Accounts | #1,105 | #1,129 | +#24 |
| ARPPA ($) | $297 | $248 | -$49 |
Cash Wagers:
Cash Wagers decreased by $711,000 (-9.07%).
NAGGR:
NAGGR decreased by $47,800 (-14.58%).
Active Player Accounts:
Active Player Accounts increased by 24 (+2.17%).
ARPPA:
ARPPA decreased by $49 (-16%).
Ontario iGaming Market: February 2025 in Review

Overall, the analyses reveal a story of remarkable growth and progress. From April 2022 to February 2025, we've seen substantial increases in all key metrics, demonstrating the strength of our platform and the loyalty of our players. While there were minor fluctuations in the month-over-month analysis, the long-term trend is overwhelmingly positive.
Here are the average stats for the all-time (since April 2022) and year-to-month (since January 2025).
| Stats Overview | All Time | YtoM |
|---|---|---|
| Cash Wagers | $4,959,400 | $7,480,500 |
| NAGGR | $193,403 | $304,000 |
| Active Player Accounts | #701 | #1,117 |
| ARPPA | $270 | $273 |
Note: The report was retrieved on 7 April 2025 from iGaming Ontario’s Market Performance Report, which includes data updated to February 2025.
For Casino Rewards fans, there are 7 Casino Rewards casinos in Ontario operating fully legally in the jurisdiction.

Yusaku is a Casino Group Reviews editor who is committed to providing unique and valuable insights. He has been in the iGaming industry since 2020, working in various positions for international online casinos. His experience also includes reviewing and analysing numerous online casinos and betting sites worldwide. This background allows him to understand players' diverse profiles and preferences.


